Profiling in Python: Who called the function?
I almost always view the output of the cProfile module using Gprof2dot, basically it converts the output into a graphvis graph (a .dot file), for example:
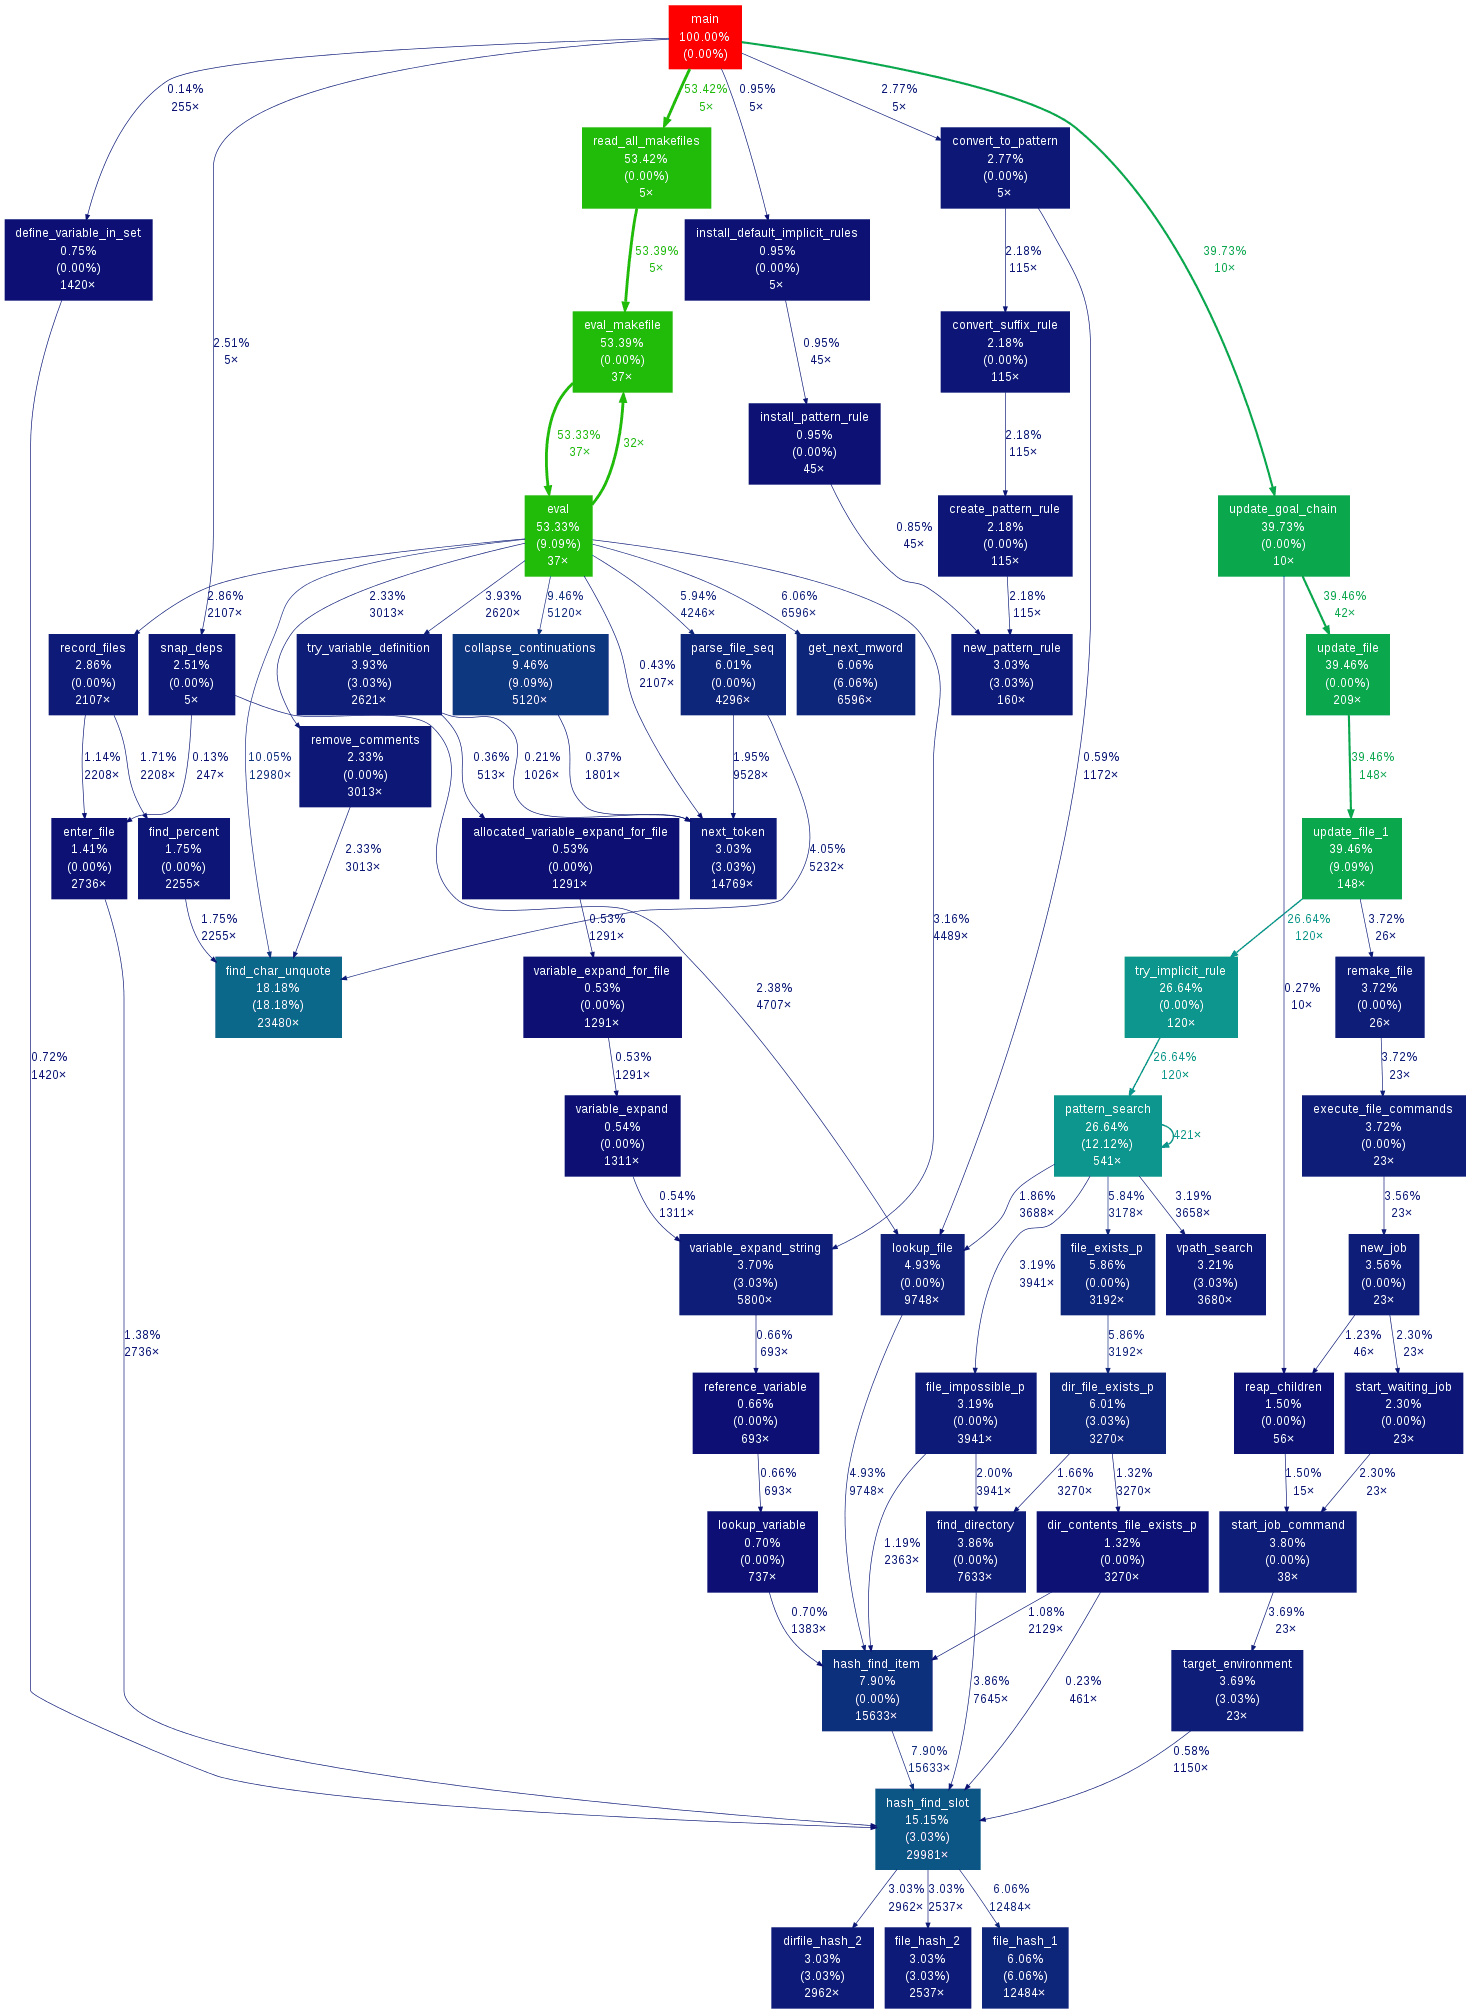
It makes it very easy to determine which function is slowest, and which function[s] called it.
Usage is:
python -m cProfile -o output.pstats path/to/your/script arg1 arg2gprof2dot.py -f pstats output.pstats | dot -Tpng -o output.png
That may not answer your question directly, but will definitely help. If use the profiler with option --sort cumulative it will sort the functions by cumulative time. Which is helpful to detect not only heavy functions but the functions that call them.
python -m cProfile --sort cumulative myScript.pyThere is a workaround to get the caller function:
import inspectprint inspect.getframeinfo(inspect.currentframe().f_back)[2]You can add as many f_back as you want in case you want the caller caller etcIf you want to calculate frequent calls you can do this:
record = {}caller = inspect.getframeinfo(inspect.currentframe().f_back)[2]record[caller] = record.get(caller, 0) + 1Then print them by order of frequency:
print sorted(record.items(), key=lambda a: a[1])