svg diagrams using python
As you're looking for simple line graphics, probably, CairoPlot will fit your needs as it can generate svg output files out of the box. Take a look at this.
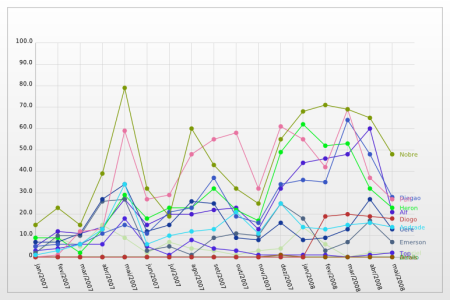
This example image shows only a few of its capabilities. Using the trunk version available at launchpad you'll be able to add a legend box and add axis titles.
Besides that, using the trunk version, it's possible to generate:
- DotLine charts (the ones I believe you need)
- Scatter charts
- Pie/Donut charts
- Horizontal/Vertical Bar charts
- Gantt charts